
Software installation
Installing R and RStudio
R is a programming language and software environment designed for statistical computing, data analysis, and visualization. It was created in the early 1990s by Ross Ihaka and Robert Gentleman at the University of Auckland, New Zealand, and has since grown into one of the most widely used tools in data science, particularly for statistical modeling.
R is open-source, meaning it is freely available and supported by a large global community of users and developers. This community continuously develops new tools and packages that extend R’s capabilities, making it highly adaptable to diverse fields such as ecology, genetics, economics, social sciences and, as in this case, soil science.
R is particularly well-suited for soil science applications because it offers comprehensive tools for:
Data management: Efficiently handle, clean, and transform large soil datasets
Statistical analysis: Perform descriptive and inferential statistics, ANOVA, regression models, and more
Spatial analysis: Work with geographic data using packages like
{terra}and{sf}Digital Soil Mapping: Apply machine learning algorithms for predictive soil mapping
Visualization: Create publication-quality maps, charts, and graphs using
{ggplot2}and other visualization toolsReproducibility: Share analyses through scripts that others can replicate and verify
In the context of SoilFER, the FAO Global Soil Partnership (GSP) and Digital Soil Mapping initiatives, R provides standardized workflows that promote collaboration, transparency, and scientific rigor.
To start using R, you need two main components:
R: The core programming language and computational engine
RStudio: An integrated development environment (IDE) that makes working with R easier
0.0.1 Installing R
Step 1: Visit the Comprehensive R Archive Network (CRAN): https://cran.r-project.org/
Step 2: Choose your operating system:
Windows: Click “Download R for Windows” → “base” → “Download R-4.x.x for Windows”
macOS: Click “Download R for macOS” → Select the appropriate
.pkgfile for your macOS versionLinux: Follow the distribution-specific instructions
Step 3: Run the installer and follow the prompts. Accept the default settings unless you have specific preferences.
0.0.2 Installing RStudio
Step 1: Visit RStudio’s website: https://posit.co/download/rstudio-desktop/
Step 2: Download the free RStudio Desktop version for your operating system
Step 3: Install RStudio by running the installer
Once installed, R provides the underlying engine for data analysis but working directly in base R can be challenging due to its command-line interface.
Important
- Install R before installing RStudio, as RStudio requires R to function.
0.0.3 Verifying Installation
After installation, open RStudio. You should see a window with several panes:
Console (bottom left): Where R commands are executed
Source (top left): Where you write and edit scripts
Environment/History (top right): Shows variables and command history
Files/Plots/Packages/Help (bottom right): File browser, plot viewer, package manager, and help documentation
Try typing a simple command in the Console window:
If you see the results, R and RStudio are properly installed in your system.
Setting Up Google Earth Engine
Google Earth Engine (GEE) is a cloud-based geospatial analysis platform that provides access to an extensive catalog of satellite imagery and geospatial datasets alongside the computational infrastructure needed to process them at planetary scale. Launched by Google in 2010 and made available to the research community in 2012, GEE has fundamentally changed how scientists approach large-scale environmental and geospatial analysis by eliminating the need to download and manage terabytes of raw imagery locally.
In this manual, GEE is used to access the different soil covariates that are used to:
- Create a robust soil sampling design based on the SCORPAN framework
- Predict soil properties in the Digital Soil Mapping workflow.
0.0.4 Step 1: Create a Google Account
GEE requires a Google account. If you do not already have one, create a free account at https://accounts.google.com. Use an institutional address (university or research organization) if possible, as this can facilitate the approval process.
0.0.5 Step 2: Register for a GEE Account
GEE access requires prior registration. Navigate to the Earth Engine registration page:
https://earthengine.google.com/register
Select Register a Noncommercial or Commercial Cloud project. On the next screen, choose Unpaid usage and then select the project type that best describes your work (e.g., Academia & Research).
Note on Account Approval
GEE registration is subject to manual review by Google. Approval typically takes between a few hours and two business days. You will receive a confirmation email once your account is activated. Register well in advance of any practical session that requires GEE access.
0.0.6 Step 3: Create or Select a Google Cloud Project
GEE now operates within the Google Cloud infrastructure. During registration you will be prompted to either create a new Google Cloud project or link an existing one. For training purposes, create a new project with a descriptive name such as soilfer-training. Note the Project ID, as you will need it when initializing GEE from Python or when sharing scripts with colleagues.
0.0.7 Step 4: Access the GEE Code Editor
Once your account is approved, open the JavaScript-based Code Editor at:
https://code.earthengine.google.com
The GEE Code Editor (https://code.earthengine.google.com) is a browser-based integrated development environment (IDE) designed specifically for writing, testing, and running Earth Engine scripts in JavaScript. It requires no local software installation beyond a modern web browser and provides immediate access to the full GEE API and data catalog. Figure 0.1 shows a schematic of the interface layout.
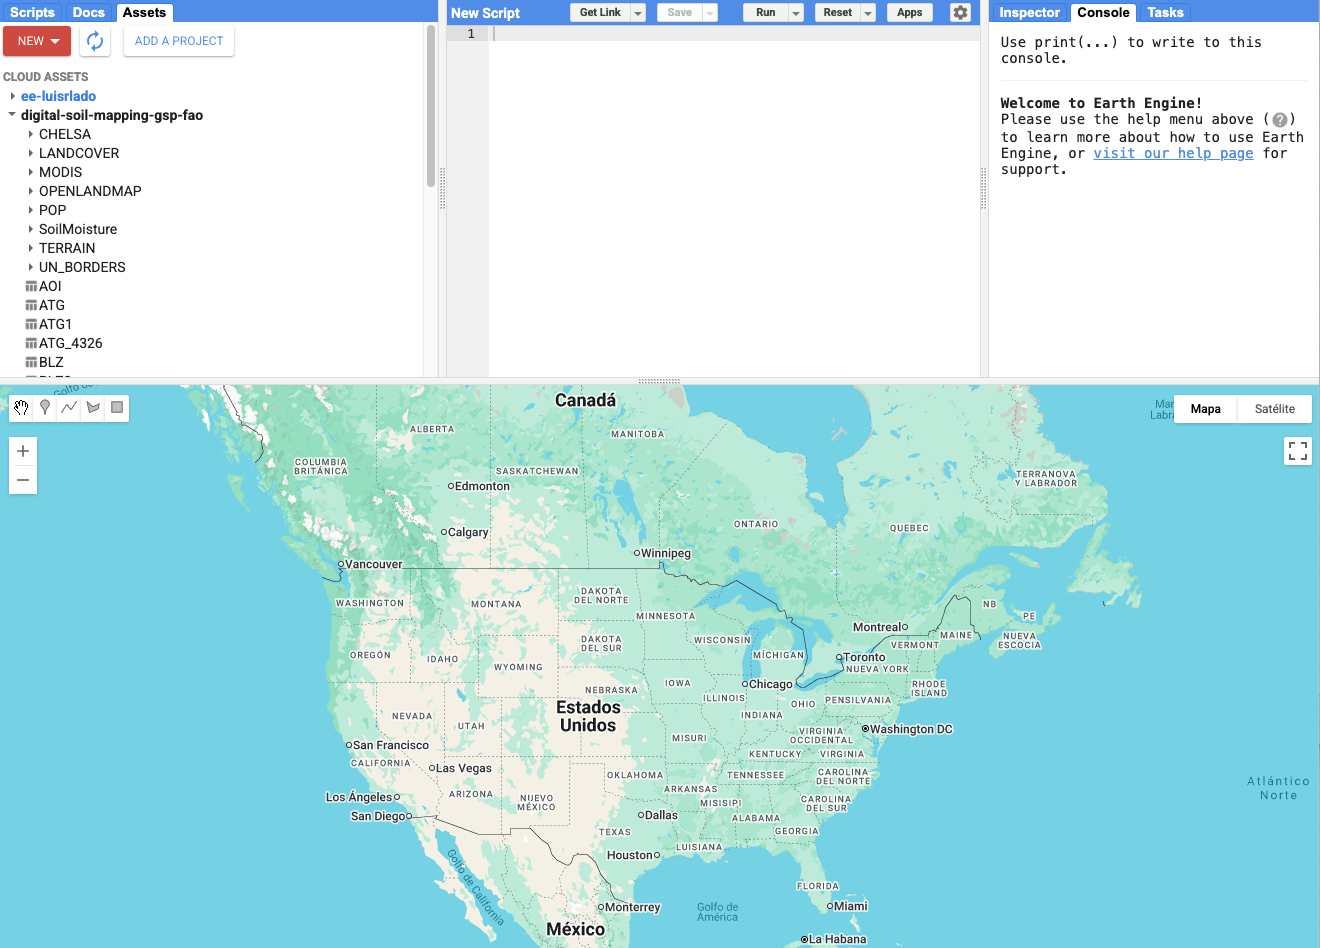
Figure 0.1: Layout of the Google Earth Engine Code Editor interface.
The interface is organized into four functional zones: a left panel with navigation and data discovery tools, a central code editing area, a right panel for output inspection and task management, and a lower interactive map.
0.0.7.1 Left Panel: Scripts, Assets, and Documentation
The left panel is divided into three tabs. The Scripts tab provides a personal repository for saving and organizing your GEE scripts, organized into folders. Scripts can be shared with other GEE users by generating a link, which is useful for collaborative training exercises. A Reader and Writer permission system controls who can view or edit shared scripts. The Examples folder within the Scripts tab contains a large collection of community-contributed scripts covering common use cases, which serve as an excellent learning resource.
The Assets tab allows you to upload and manage personal geospatial assets — raster images, vector feature collections, or tables — that can then be loaded into scripts using ee.Image() or ee.FeatureCollection() calls. The FAO GSP shared assets used in this training (e.g., CHELSA climate layers and OpenLandMap terrain derivatives) are hosted in a shared project asset folder (projects/digital-soil-mapping-gsp-fao) that your account must be authorized to access.
The Docs tab provides a searchable, offline-accessible reference for the entire JavaScript GEE API. Every function, data type, and parameter is documented here with descriptions and usage examples. When you are uncertain about a function’s arguments or return type, searching Docs is usually faster than consulting external documentation.
0.0.7.2 Central Panel: The Code Editor
The central panel is where scripts are written and executed. It provides syntax highlighting for JavaScript, basic autocompletion for GEE API methods, and inline error indicators. Scripts are saved automatically to your personal repository. The toolbar above the editor contains several important controls:
The Run button (or Ctrl+Enter / Cmd+Enter) executes the entire script. GEE processes the script server-side, so execution does not transfer data to your browser — only the final computed outputs and any print() statements are returned. This means that even very large computations feel responsive in the editor, as you are only waiting for metadata and visualization tiles rather than raw data downloads.
The Save button commits the current script state to your repository. It is good practice to save frequently and to use the Get Link button to generate a shareable URL that encodes the current script state. This URL is particularly useful for sharing reproducible workflows in a training context.
The Reset button clears all layers from the map and resets the console, without deleting your script. Use this when you want to re-run a script cleanly after making changes.
The Apps button allows you to publish a script as a standalone GEE application with a simplified user interface, which is useful for sharing tools with non-technical audiences.
0.0.7.3 Right Panel: Console, Inspector, and Tasks
The right panel has three tabs that serve distinct purposes during script development and execution.
The Console tab displays the output of print() statements in your script. Printing an Earth Engine object such as an image collection or feature collection shows its metadata: the number of elements, band names, projection, spatial extent, and property dictionary. This is the primary tool for debugging scripts and verifying that filtering and processing steps are producing the expected results. For example, printing the Sentinel-2 collection after applying cloud filters confirms how many scenes are available before computing the median composite.
The Inspector tab activates a point-query tool. When active, clicking any location on the map returns the pixel values of all currently displayed layers at that point, along with their band names and data types. This is particularly useful to quickly check that computed indices or terrain derivatives have realistic values across the study area without exporting the full raster.
The Tasks tab is essential for managing data exports. GEE does not automatically execute export operations when a script is run — instead, exports are queued as tasks that must be submitted manually. After running a script that contains Export.image.toDrive() calls, pending tasks appear in this tab with a yellow Run button. Clicking Run for each task opens a dialog where you can confirm or modify the export parameters (description, folder, scale, CRS) before submission. Once submitted, tasks progress through READY, RUNNING, and COMPLETED states. Completed exports appear in the designated Google Drive folder as GeoTIFF files. Failed tasks display an error message that can help diagnose issues related to computation limits, memory, or invalid geometries.
0.0.7.4 Lower Section: The Interactive Map
The lower section of the Code Editor is an interactive map, similar in functionality to Google Maps, onto which computed layers are rendered as tiled overlays. Layers are added using Map.addLayer(), which accepts an Earth Engine image or feature collection, a visualization parameter dictionary specifying band names, color palettes, and value ranges, and an optional display name.
The map toolbar provides tools for navigating (pan and zoom), measuring distances, and drawing geometries. The geometry drawing tools — point, line, polygon, and rectangle — allow you to define regions of interest directly on the map and reference them as variables in your script. This is a convenient way to quickly define a custom study area without needing to upload a vector file. Drawn geometries are automatically added to the Geometry Imports section at the top of the script.
The layer manager in the upper right corner of the map lists all currently added layers with toggle controls for visibility and opacity sliders. Each layer can be independently shown or hidden, making it easy to compare multiple products — for instance, toggling between the ESA WorldCover land cover and the Sentinel-2 RGB composite to verify that the cropland mask aligns with visible agricultural patterns.
Browser Compatibility
The GEE Code Editor is optimized for Google Chrome. While it functions in other modern browsers (Firefox, Edge), some features such as autocompletion and the geometry import panel may behave differently. For the best experience during training sessions, use an up-to-date version of Google Chrome.
0.0.8 Step 5: Prepare Your Google Drive Export Folder
The SoilFER covariate extraction script exports raster files directly to your Google Drive. Before running the script, create a folder named GEE_Exports in the root of your Google Drive at https://drive.google.com. This folder name is referenced explicitly in the export configuration of the script (see the exportFolder variable in Section 1 of the script). If you prefer a different folder name, update this variable accordingly before running.
Installation of QGIS
QGIS is a free and open-source desktop GIS application used to visualise and inspect spatial datasets. The Long-Term Release (LTR) version is recommended for stability. Go to the QGIS download page and choose your installation: